LEDC country: India
Per capita income levels
|
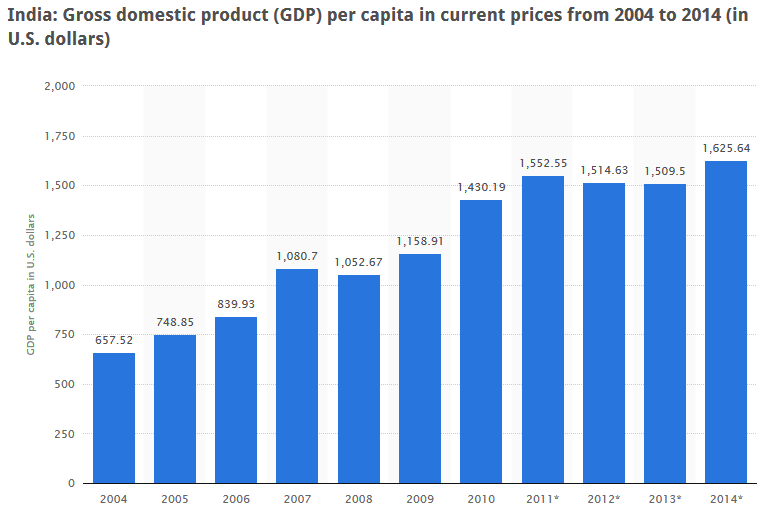
As shown in the picture (to the
left), India's average income has increased from 657.52 dollars in 2004 to 1625.64
dollars in 2014. There are many reasons to how this has happened. One including
the fact that the services part in the economy grew faster than it did last
year because of the elections, different parties (political parties and
candidates) put in a lot of money into the economy to win. ‘Electricity, gas
& water supply’ increased by 10.2%, ‘financing, insurance, real estate and
business services’ increased by 10.4%, ‘community, social and personal
services’ increased by 9.1 per cent, ‘trade, hotels, transport &
communication’ which is a major factor of the GDP increased fairly well by
2.8%. All of this led to increase in employment therefore led to increase in
the GDP.
|
Access to safe drinking water
|
India’s increasing population is already adding stress to
natural resources. Most of the water in India is contaminated by pollution,
sewage and chemical waste. There are organizations within India to help improve
the problem and it has been working but has not shown immense amounts of improvement.
It estimated that 21% of infectious diseases reported in India are associated
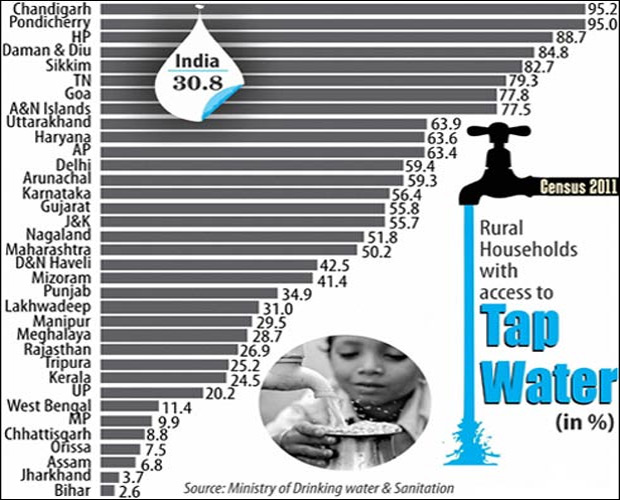
with unsafe water. Diarrhea itself causes more than 1600 deaths per day. 88% of India's population (1.27 billion people) have access to safe drinking water.
The picture (on the right) shows the percentage of households (in rural areas) with access to tap water. In 2011 |
|
Unemployment, underemployment and Adult literacy rate
|
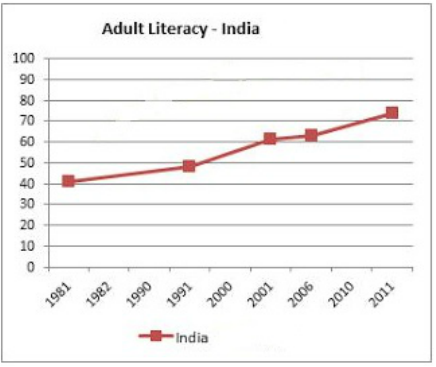
The adult literacy rate in India
has gone from to 62.8% in 2006 to 74.04% in 2011 as shown in the graph (to the left). The adult literacy rate is
increasing but gradually. The reason behind having a low literacy rate is the
lack of school facilities and teacher staff in rural areas. The 188 government
primary schools in northern and central India show that 59% of schools have no
water facilities and 89% of schools with no toilets. There have been many
dropouts and less enrollments which results to a low literacy rate, which then
leads to unemployment. The percentage of the unemployed is 3.7% in 2013 and is
estimated to increase to 3.8% in 2014. India’s growing population is another reason of unemployment because with a larger population jobs are limited therefore leaving individuals unemployed. Youth underemployment is very high in India, 85% of youth have low pay.
|
Life Expectancy
|
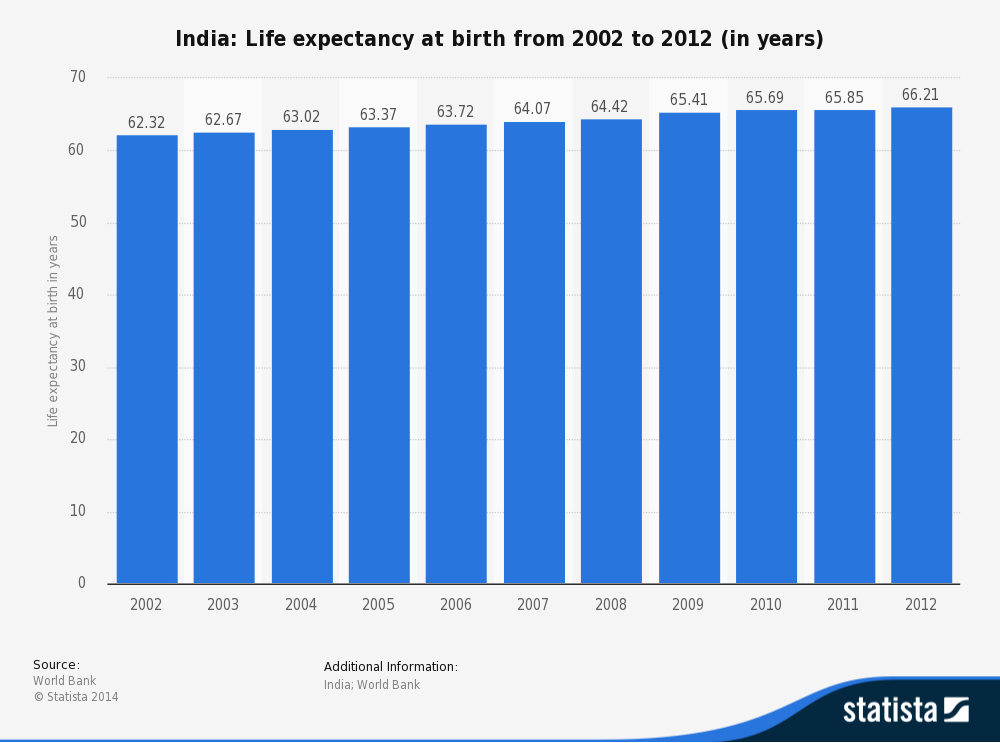
The life expectancy in India for females is 67.3, the life expectancy for males is 63.8 and the overall life expectancy in India is 65.5. The graph on the right titled "India: Life...2012 (in years)" shows the life expectancy from 2002 to 2012. The life expectancy is increasing showing that health facilities are improving and also the fact that more can afford medicines and are more sanitized.
|
|
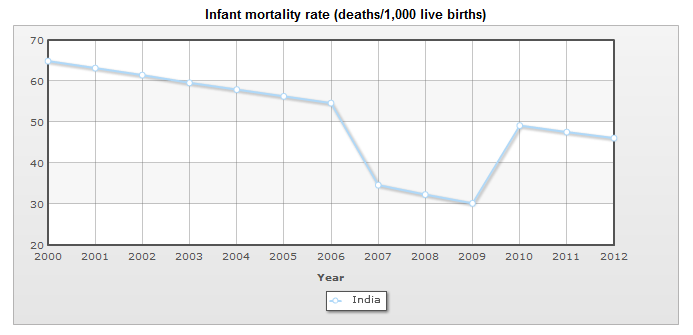
infant mortality rate
|
In the graph titled "Infant morality...live births)" it shows the amount of deaths per 1000 live births during 2000 till 2012. In 2012 there was roughly 46 deaths per 1000 live births and in 2014 there is 43.19 deaths per 1000 live births. Most deaths occur in rural areas, this is due to lack of health facilities and the surroundings of the infant.
|
Bibliography
- Kaul, Vivek. "India’s GDP Grows Fastest since March 2012: Too Early to Cheer, or Give Modi Credit." First Biz. N.p., 30 Aug. 2014. Web. 4 Nov. 2014. <http%3A%2F%2Ffirstbiz.firstpost.com%2Feconomy%2Findias-gdp-grows-fastest-since-march-2012-too-early-to-cheer-or-give-modi-credit-96281.html>.
- "India - Gross Domestic Product (GDP) per Capita 2014 | Statistic." Statista. N.p., n.d. Web. 04 Nov. 2014. <http://www.statista.com/statistics/263776/gross-domestic-product-gdp-per-capita-in-india/>.
- "Water.org." Waterorg. N.p., n.d. Web. 03 Nov. 2014. <http://water.org/country/india/>
- "Water, Environment and Sanitation." UNICEF India. N.p., n.d. Web. 04 Nov. 2014. <http://www.unicef.org/india/wes.html>.
- A graph indicating the percentage of rural households with access to tap water. Digital image. Post. N.p., 12 Jan. 2o13. Web. 4 Nov. 2014. <http%3A%2F%2Fpost.jagran.com%2Ftreated-tap-water-accessible-to-only-308-percent-of-rural-population-1357992074>.
- "Statistics." UNICEF. N.p., 27 Dec. 2013. Web. 05 Nov. 2014. <http://www.unicef.org/infobycountry/india_statistics.html>.
- "India Tops in Adult Illiteracy: U.N. Report." The Hindu. N.p., 29 Jan. 2014. Web. 05 Nov. 2014. <http://www.thehindu.com/features/education/issues/india-tops-in-adult-illiteracy-un-report/article5629981.ece>.
- James, Sebastian. Adult Literacy - India. Digital image. Private Sector Development. N.p., 17 July 2013. Web. 05 Nov. 2014. <http://blogs.worldbank.org/psd/why-china-ahead-india-fascinating-analysis-amartya-sen>.
- "Literacy in India." Wikipedia. Wikimedia Foundation, 29 Oct. 2014. Web. 05 Nov. 2014. <http://en.wikipedia.org/wiki/Literacy_in_India>.
- Rajadhyaksha, Madhavi. "Underemployment High among Youngsters - The Times of India." The Times of India. N.p., 7 Oct. 2013. Web. 05 Nov. 2014. <http://timesofindia.indiatimes.com/city/mumbai/Underemployment-high-among-youngsters/articleshow/23618456.cms>.
- "India Infant Mortality Rate." - Demographics. N.p., 23 Aug. 2014. Web. 05 Nov. 2014. <http://www.indexmundi.com/india/infant_mortality_rate.html>.
- "India - Life Expectancy 2012 | Statistic." Statista. N.p., n.d. Web. 05 Nov. 2014. <http://www.statista.com/statistics/271334/life-expectancy-in-india/>.
